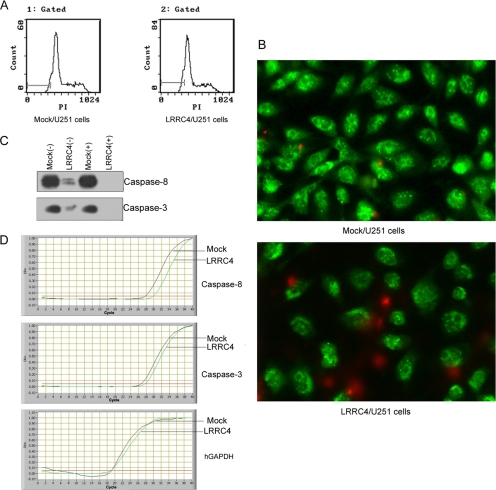
Figure 6.
Apoptosis assay of LRRC4 in the mock- and LRRC4-transfected U251cells. (A) Flow cytometry histogram displaying apoptosis apex in front of G1 phase. (B) AO/EB dual staining showing necrosis cells and apoptosis cells. (C) Western blotting image showing caspase-8 and caspase-3 at the protein level in the mock- and LRRC4-transfected U251 cells (+/− serum). β-actin is used as the loading control. (D) Real-time PCR products displaying caspase-8 and caspase-3 mRNA in the mock- and LRRC4-transfected U251 cells.

