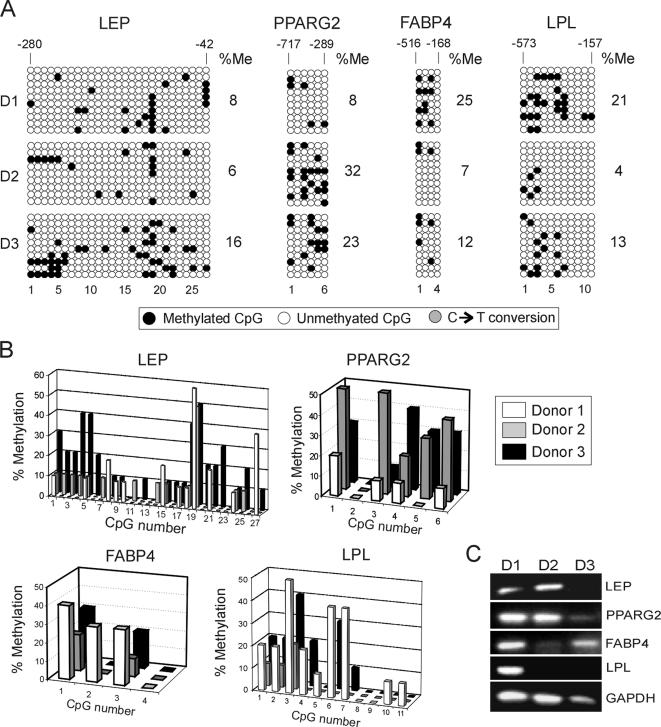
Figure 6.
DNA methylation analysis of LEP, PPARG2, FABP4, and LPL in freshly isolated, uncultured ASCs. (A) Bisulfite analysis of CpG methylation in ASCs from three donors (D1–D3). Percentage of overall CpG methylation (%Me; ●) is shown. (B) Proportions of individual methylated CpGs at each promoter and or each donor. CpG numbers are indicated, no. 1 being the 5′ most CpG. Note that analysis of 10 bacterial clones for each donor was barely sufficient for statistical comparisons. (C) Endpoint RT-PCR analysis of expression of indicated genes in ASCs purified from donors D1, D2, and D3.

