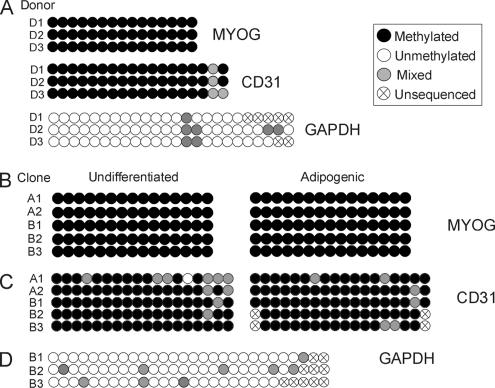
Figure 8.
DNA methylation analysis of MYOG, CD31, and GAPDH in uncultured and cultured ASCs. (A) Analysis of ASCs purified from donors D1–D3 resulting from direct sequencing of PCR products after bisulfite conversion. Representative sequences are shown in Supplemental Figure S3. (B and C) Analysis of MYOG (B) and CD31 (C) methylation in undifferentiated and adipogenic-differentiated ASC clones. (D) Analysis of GAPDH methylation in undifferentiated ASC clones B1–B3. The “mixed” methylation pattern is due to the analysis of mixed cell populations because PCR products resulting from bisulfite conversion were not cloned.

