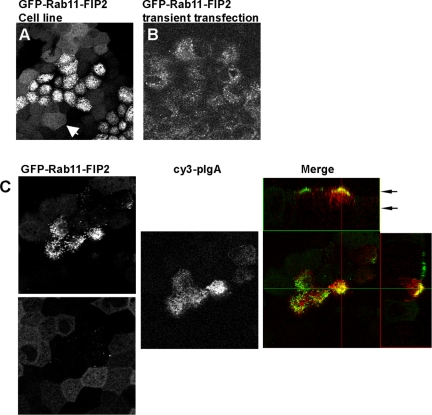
Figure 3.
Distribution of EGFP-Rab11-FIP2 in stably overexpressing cell lines. (A) T23 cells stably expressing EGFP-Rab11-FIP2 exhibit two different morphologies. White arrowhead indicates a cell with a more diffuse distribution of EGFP-Rab11-FIP2. (B) Transiently transfected MDCK II cells show only a punctuate subapical distribution of EGFP-Rab11-FIP2. (C) T23 cells expressing EGFP-Rab11-FIP2 in the presence or absence of pIgA (red in merge). On induction of trafficking, the EGFP-Rab11-FIP2 exhibits dynamic relocalization to the more traditional recycling system. EGFP images are from two different z-positions in the same confocal stack, as indicated in the x-y orthogonal view, to enhance the visualization of both morphologies.

