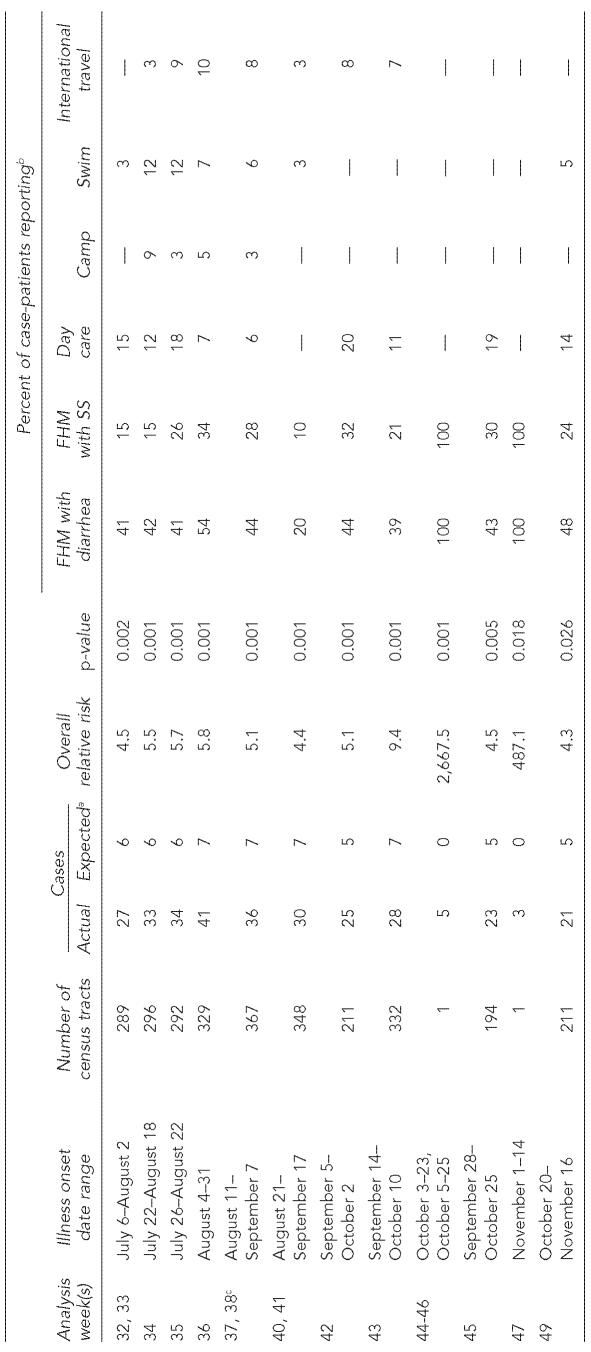
Table.
Descriptions of live clusters of confirmed shigellosis cases detected using the SaTScan prospective space-time scan statistic, Chicago, 2002
Rounded to nearest whole number
Risk factors are not mutually exclusive. Reported day care attendance, summer camp attendance, and international travel among family or household members (as well as case-patients themselves) are included in these percentages.
Values shown are for Week 38. The expected number of cases, number of census tracts in the cluster, and p-value did not change during the weeks that the cluster was identified, but the observed number of cases and overall relative risk in Week 38 changed from 35 to 36, and from 4.9 to 5.1, respectively.
FHM = family or household member
SS = Shigella sonnei infection

