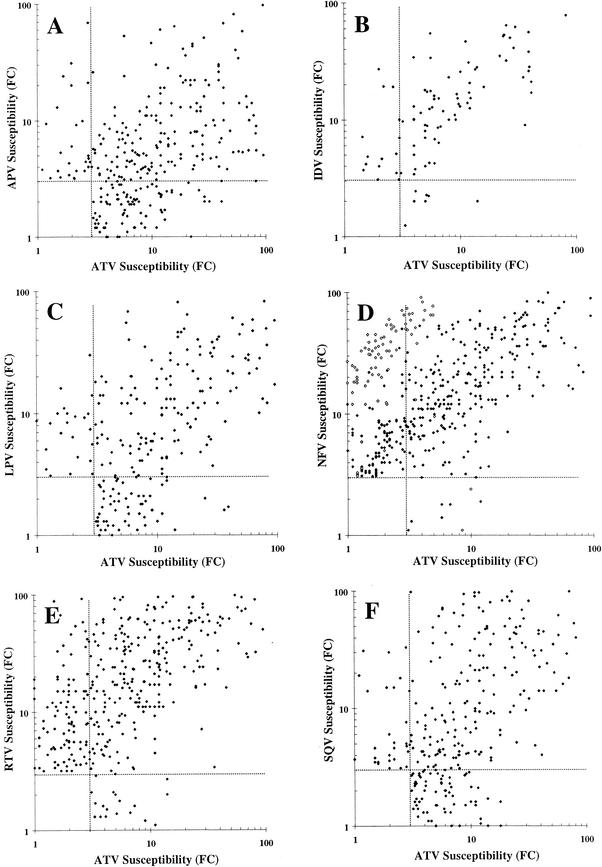
FIG. 2.
Comparative scatter plots of resistant isolates. Each panel plots individual isolates displaying a ≤3.0-fold change in susceptibility to atazanavir (ATV) and/or amprenavir (APV; panel A, 348 isolates), indinavir (IDV; panel B, 94 isolates), lopinavir (LPV; panel C, 265 isolates), nelfinavir (NFV; panel D, 492 isolates), ritonavir (RTV; panel E, 434 isolates), and saquinavir (SQV; panel F, 349 isolates). Open squares in panel D represent isolates containing D30N substitutions. Dotted lines identify the position of a 3.0-fold change in susceptibility to each of the PIs.

