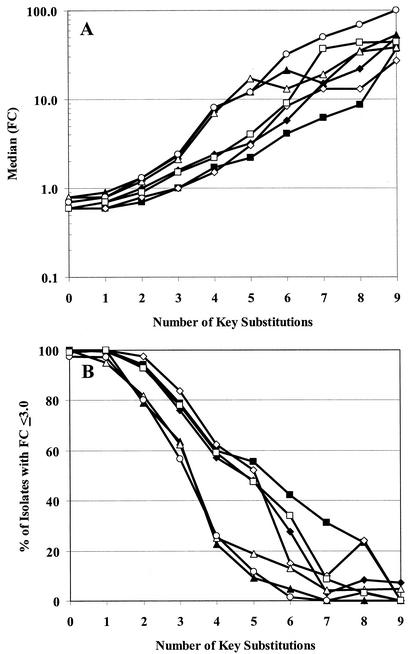
FIG. 4.
Relationship between number of key substitutions and susceptibility to PIs. Panel A plots the range of FCs for all seven PIs relative to a number of key substitutions present. The dotted line identifies the position of a 3.0-fold change in susceptibility. Panel B plots the percentage of isolates displaying a ≤3.0-fold change in susceptibility to each of the PIs for isolates containing one to eight key substitutions: atazanavir (⧫), amprenavir (▪), indinavir (▴), lopinavir (◊), nelfinavir (▵), ritonavir (○), and saquinavir (□).

