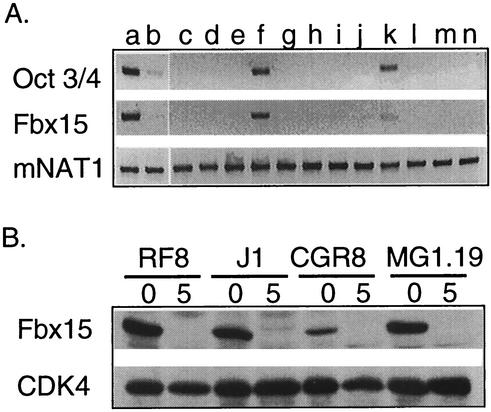
FIG. 1.
(A) RT-PCR analysis showing the expression profiles of mouse Oct3/4, Fbx15, and NAT1. Lanes: a, undifferentiated ES cells; b, differentiated ES cells; c, brain; d, heart; e, kidney; f, testis; g, spleen; h, muscle; i, lung; j, stomach; k, ovary; l, thymus; m, liver; n, skin. (B) Western blot analysis showing Fbx15 expression in the RF8, J1, CGR8, and MG1.19 ES cell lines. Lysates were collected from ES cells maintained undifferentiated (lanes 0) or treated with retinoic acid for 5 days (lanes 5). Western blotting was performed with anti-Fbx15 serum or anti-CDK4 antibody.

