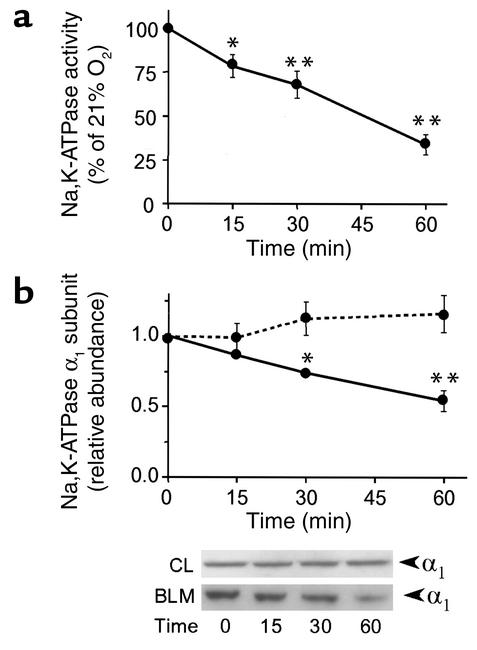
Figure 2.
Hypoxia decreases Na,K-ATPase activity and α1 protein abundance at the plasma membrane. A549 cells were exposed to 1.5% O2 for 15, 30, or 60 minutes. (a) Time-dependent changes in Na,K-ATPase activity were determined by 86Rb+ uptake and expressed as a percentage of control (control = 21% O2). Data are presented as the means ± SD of four independent experiments performed in duplicate. *P < 0.05 and **P < 0.01. (b) Na,K-ATPase α1 subunit abundance in BLM and in cell lysates. Equal amounts of proteins were analyzed (BLM, 5 μg; cell lysates, 30 μg). Means ± SD of four experiments (the dotted line represents cell lysates and the solid line represents BLM) and representative Western blots (inset) are shown. *P < 0.05 and **P < 0.01. CL, cell lysates.

