Figure 5.
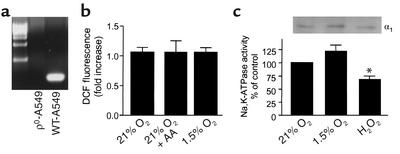
Effect of mitochondrial ROS on Na,K-ATPase activity and abundance in A549 cells. (a) Southern blot analysis of total cellular DNA from wild-type and ρ0-A549 cells. Hybridization was performed with a cytochrome oxidase subunit II probe, spanning bp 7757–8195, generated by RT-PCR. (b) ρ0-A549 cells were incubated with DCFH-DA (10 μM) for 60 minutes at 21% or 1.5% O2 in the presence or absence of AA (1 μg/ml). Fluorescence was measured in cell lysates. Data were normalized to values obtained from normoxic untreated controls. Each bar represents the mean ± SD of three experiments. (c) In the lower panel, ρ0-A549 cells were exposed to 21% O2, 1.5% O2, or t-H2O2 (100 μM), and Na,K-ATPase activity was determined by 86Rb+ uptake and expressed as a percentage of control. Each bar represents the mean ± SD of three experiments performed in duplicate. *P < 0.05. In the upper panel, ρ0-A549 cells were exposed to 21% O2, 1.5% O2, or t-H2O2 (100 μM), and Na,K-ATPase protein abundance was determined by surface biotinylation as described in Figure 2.

