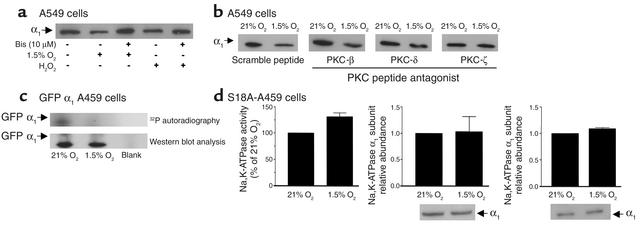
Figure 6.
Effect of PKC activation and Ser-18 mutation on Na,K-ATPase activity and abundance in A549 cells. (a) Cells were preincubated with 10 μM Bis or vehicle for 30 minutes, exposed to 1.5% O2 or H2O2 (100 μM), and then surface labeled with biotin. Western blots are representative of three experiments. (b) A549 cells were preincubated with PKC-β, -δ, or -ζ peptide antagonists (0.1 μM) or with a scramble peptide for 15 minutes and exposed to 1.5% O2 for 60 minutes. Cells were surface labeled with biotin as described above. A representative autoradiogram is shown (n = 3). (c) GFP α1 A549 cells were exposed to 1.5% O2 for 20 minutes, and Na,K-ATPase GFP α1 subunit was immunoprecipitated using a polyclonal GFP antibody. An in vitro phosphorylation reaction with the immunoprecipitated Na,K-ATPase, purified PKC, and [γ-32P]ATP was conducted. A representative autoradiogram of the α1 subunit phosphorylation from one of three experiments is shown with the corresponding immunoblot performed with a monoclonal anti-GFP antibody. (d) Na,K-ATPase activity and α1 subunit abundance in cell lysates and BLM lysates from S18A-A549 cells submitted to hypoxia for 60 minutes. Each bar represents the mean ± SD of four different experiments. Corresponding representative Western blots are also shown for each experimental condition.

