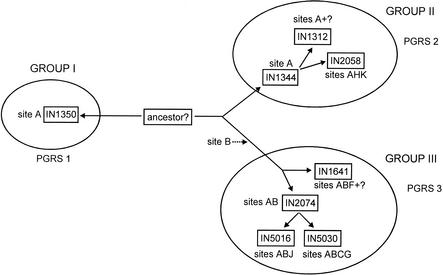
FIG. 2.
Diagrammatic representation of the relationships among low-copy-number isolates of M. tuberculosis. The relationships depicted are based primarily on the determined IS6110 insert sites, supplemented by the data derived from PGRS typing and spoligotyping. The relationships are shown diagrammatically only; the lengths of the arms do not represent evolutionary distance.

