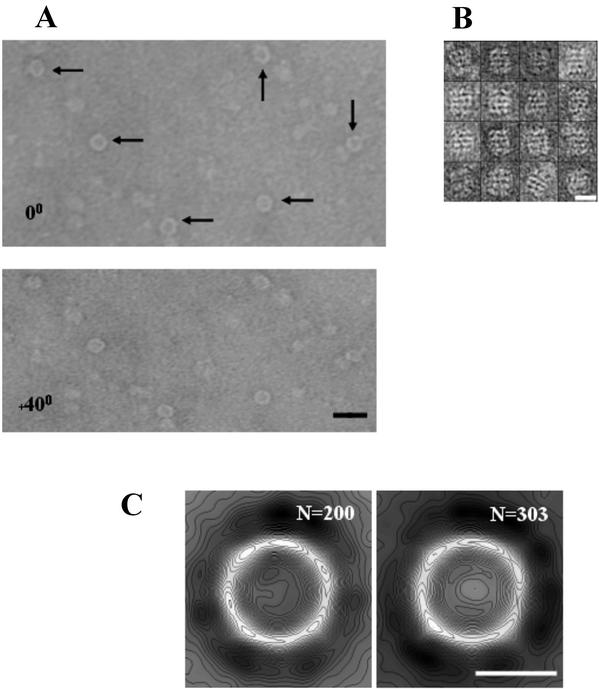
FIG. 1.
PilQ particles visualized under negative stain. (A) Tilt pairs of PilQ particles at 0° and 40°, negatively stained with 2% uranyl acetate and recorded under low-dose conditions. Arrows indicate particles presenting the face-on donut view. Scale bar, 30 nm. (B) Montage of particles presenting putative side-on views of PilQ. Measurements of individual particles found widths and heights in the range of 15 to 16.5 nm and 18 to 20 nm, respectively. Scale bar, 15 nm. (C) 2-D projection maps of the two major class averages (n = 200 and 303) of particles selected for volume back projection. Maps are low-pass filtered to 2 nm and contoured at 20 levels. Scale bar, 10 nm.

