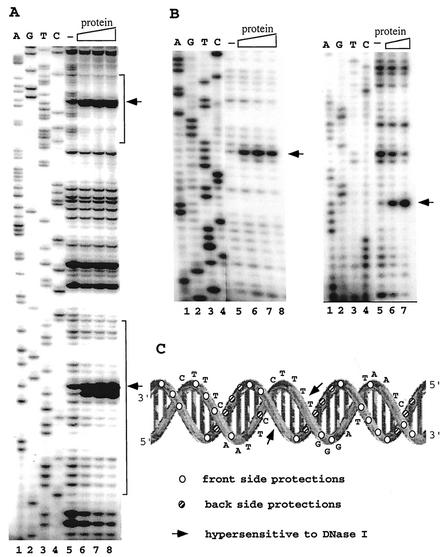
FIG. 7.
DNase I footprinting analysis of the native SSO454-SRSR complexes. (A) SRSR-2p was sequenced (lanes 1 to 4) and footprinted (lanes 5 to 8). Lane 5, no protein; lanes 6, 7, and 8, a two-, four-, and sixfold molar excess of purified protein, respectively, was incubated with 30 ng of DNA, 32P end labeled at the free 5′ end in the presence of 600 ng of pUC18 DNA, and digested with DNase I (see Materials and Methods). The positions of the two repeat units are indicated by brackets. (B) Both strands of SRSR-2c were sequenced (lanes 1 to 4) and footprinted (lanes 5 to 8). In the left gel, 72 ng of labeled DNA was complexed with no protein (lane 5) or with a 0.6-, 1.2-, or 2.4 molar protein-DNA ratio (lanes 6, 7, and 8, respectively). In the right gel, 36 ng of labeled DNA was incubated with no protein (lane 5) or with a 1.6- or 6.4-fold molar excess of protein (lanes 6 and 7, respectively). All of the footprinting samples were digested with DNase I in the presence of 600 ng of pUC18 DNA. Strongly enhanced DNase I cuts in panels A and B are indicated by arrows. (C) Data from panel B are superimposed on the secondary structure of SRSR-2c.

