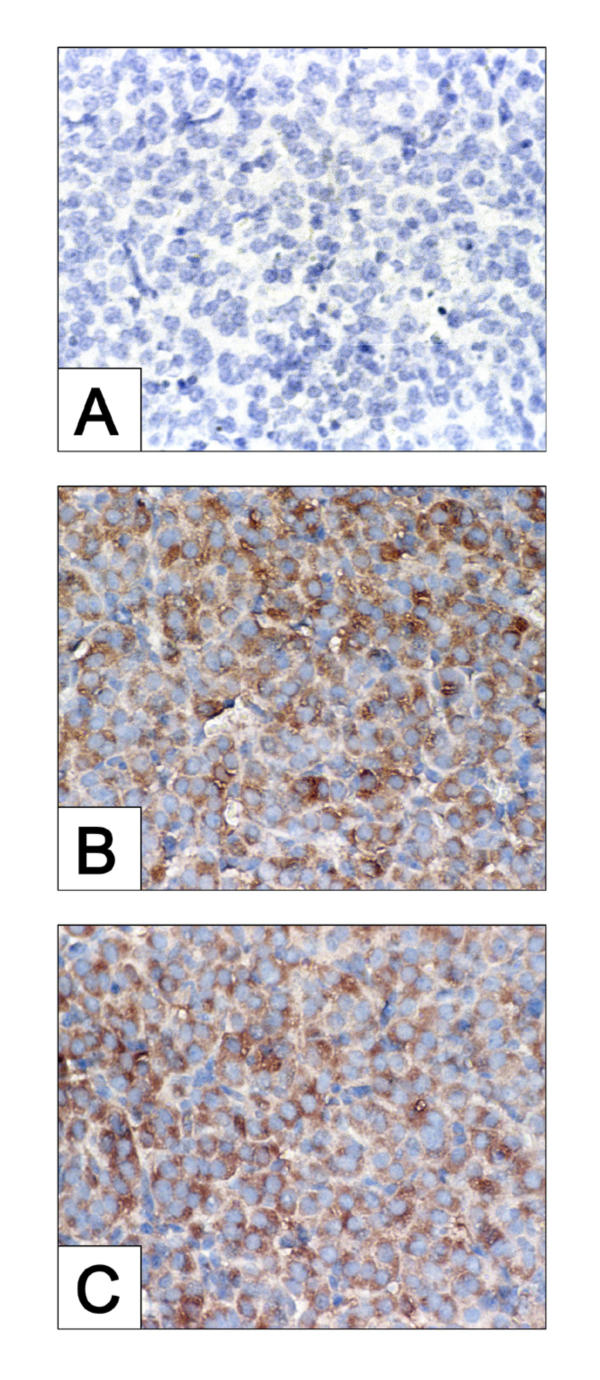
Figure 3.
Histochemical assessment of FAS in CL derived from WT and caspase-3-deficient mice following treatment with IgG, Jo2 or PGF2α. administered 24 h post ovulation and ovaries harvested 8 h post injection. Panel represents a photomicrograph of a CL section derived from WT mouse used as a negative control (no primary antibody). Panel B and C are photomicrographs of CL sections derived from WT and caspase-3-deficient mice (respectively) probed with anti-FAS antibody. Original magnification for panels A, B and C × 600.

