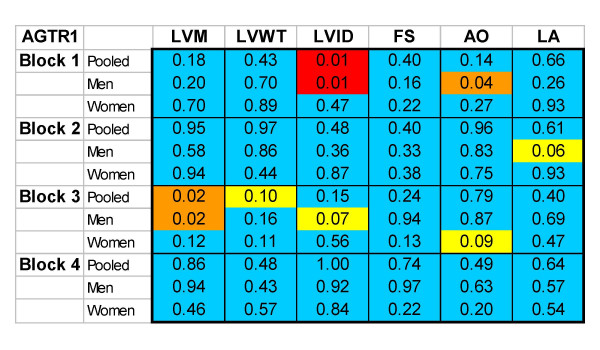
Figure 3.
Haplotype-block association grid. This figure displays block-specific haplotype associations with six phenotypes. P-values are based on a global test of differences in phenotype across all haplotypes within the block. Color coding reflects a global test of significance for differences among all haplotypes within a block (blue p ≥ 0.10, orange 0.05 ≤ P < 0.10, yellow ≤ 0.01 < P0.05, red P < 0.01).

