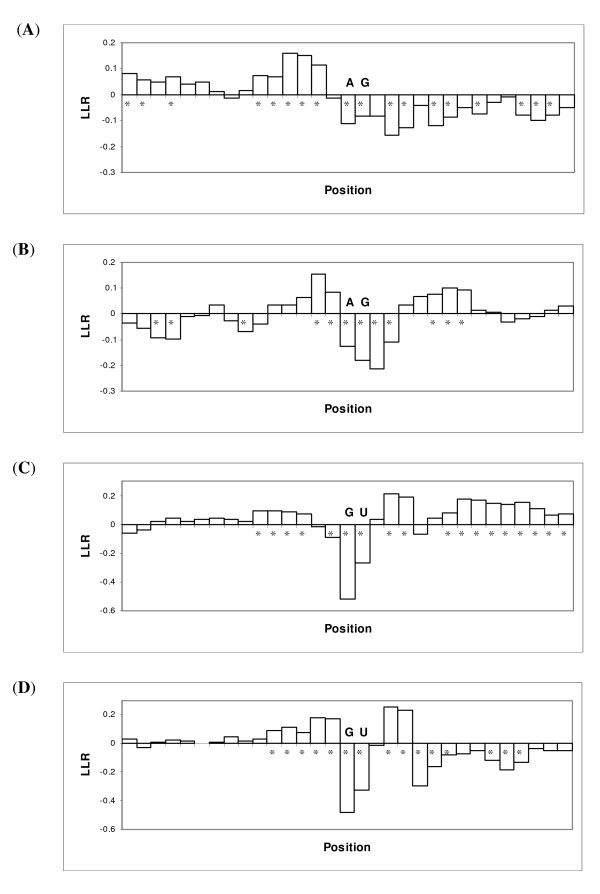
Figure 3.

Log likelihood ratio (LLR with log-base-2) of formation of loop structure at different positions around splice sites in AtGS and HsGS datasets. The sequences are shown in 5'→3' direction. Asterisked positions are those positions that show a significant difference (p < 0.05 based on the test for differences of two binomial proportions) between the frequency of "loops" in real and decoy sites. 3' AtGS (A), 3' HsGS (B), 5' AtGS (C) and 5' HsGS (D).
