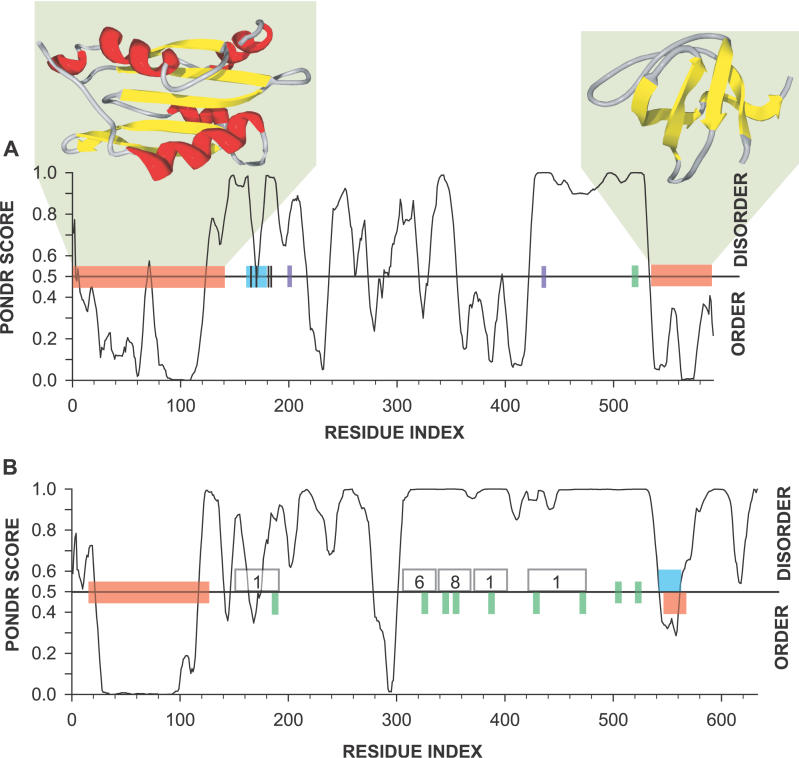
Figure 5. PONDRing Abp1p and Las17p.
(A) The PONDR VL-XT prediction for Abp1p is plotted along with bars representing the positions of the ADF domain (N-terminal orange bar, structure 1HQZ), the SH3 domain (C-terminal orange bar, structure 1JO8), a poly-proline region (green bar), a predicted α-MoRF (blue bar), known phosphorylation sites (black hash marks), and regions critical for Arp2/3 activation (purple bars).
(B) The PONDR VL-XT prediction for Las17p is plotted along with bars representing the positions of the WASP homology domain 1 (N-terminal orange bar), WASP homology domain 2 (C-terminal orange bar), poly-proline regions (green bars), and a predicted α-MoRF (blue bar). The number of interaction partners associated with a given region [39] is indicated in the numbered boxes.

