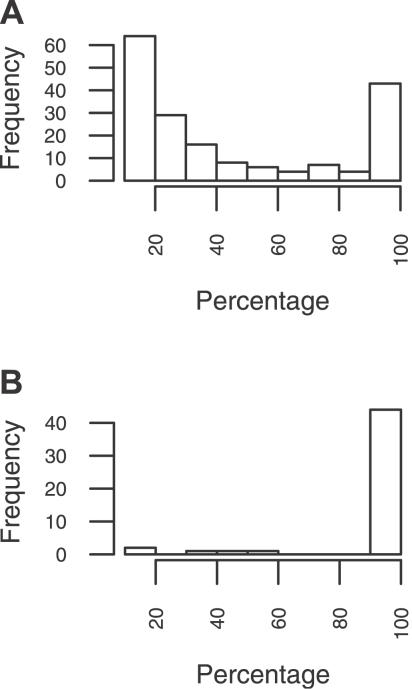
Figure 9. Step 1 of the Mapping Phase in the Comparison of S. flexneri 2457t and S. typhi ty2.
Histograms of the percentage of intersection (horizontal axis) between entries of the comprehensive table and transposable elements (A) and between entries of the comprehensive table and phages (B). See Figure 3 and Step 1: Removing trivial entries and selfish DNA.

