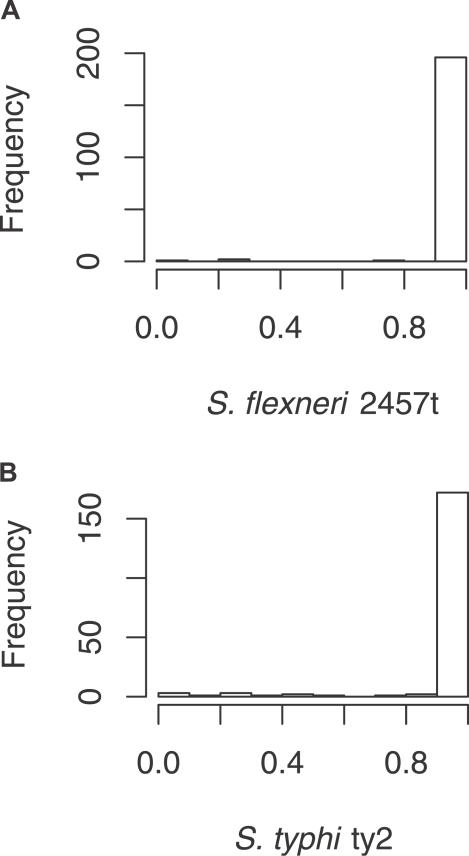
Figure 10. Histogram of Intersection Ratios between Table Entries (after Removing Trivial Entries and Selfish DNA) in the comparison of S. flexneri 2457t and S. typhi ty2.
The ratio is calculated as the intersection length divided by the length of the shortest entry.
(A) Ratios in S. flexneri 2457t and (B) ratios in S. typhi ty2. We set the default value of dupPerc to 50% since most of the histogram values are larger than that.

