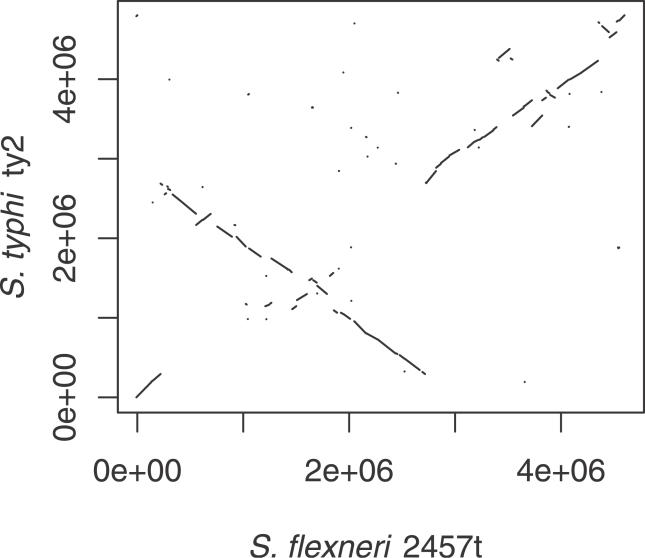
Figure 12. A Dot-Plot-Like Schematic Presentation of the Final One-to-One RF Table in the Comparison between S. flexneri 2457t (Horizontal Axis) and S. typhi ty2 (Vertical Axis).
Each line in the figure corresponds to an entry in the table. Lines corresponding to entries with a positive sign are drawn parallel to the positive diagonal and lines corresponding to entries with a negative sign are drawn parallel to the negative diagonal.

