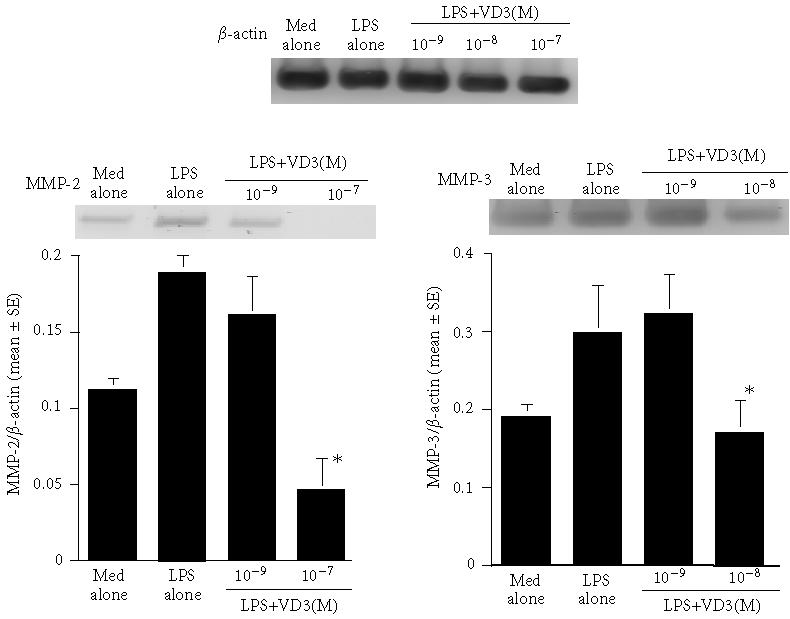
Figure 3.

Influence of vitamin D3 on mRNA expression for MMP-2 and MMP-3 in keratinocytes after LPS stimulation. Keratinocytes (2.5 × 10⁵ cells/mL) derived from cholesteatoma tissues were stimulated with 100 μg/mL lipopolysaccharide (LPS) in the presence of various concentrations of vitamin D3 for 12 hours. mRNA expressions for MMP-2 and MMP-3 were examined by RT-PCR. Each set of data was expressed as the mean ratio (target/β-actin) ±SEM of five different subjects.
