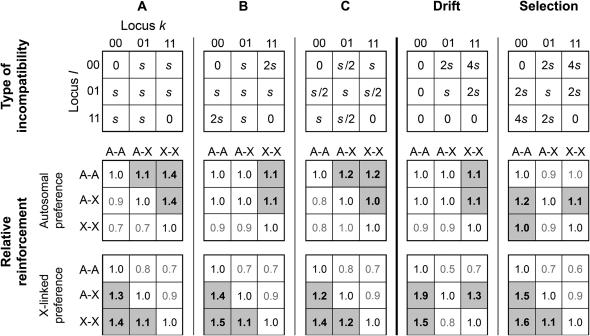
Figure 2.
The effect of sex linkage on reinforcement for five types of hybrid incompatibility. The five matrices in the top row denote five types of hybrid incompatibility at two loci, k and l. The types labeled Drift and Selection correspond to empirically observed patterns (Turelli and Orr 2000) and type C corresponds to that studied by Servedio and SÆtre (2003). Values in the center and bottom rows indicate the relative amounts of reinforcement due to A–A, A–X, and X–X incompatibilities. The amount of reinforcement for the pattern of sex linkage indicated to the left of the value is divided by that for the pattern indicated above the value. For example, the value 1.4 found in the bottom leftmost square indicates that an X–X incompatibility is expected to produce 1.4 times more reinforcement than an A–A incompatibility. Values >1 before rounding are shaded. For comparisons involving A–Y and X–Y incompatibilities, see the supplemental material at http://www.genetics.org/supplemental/.

