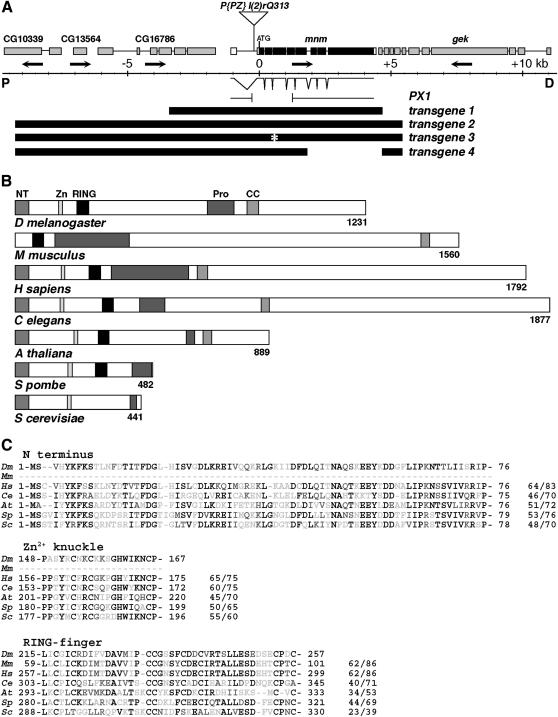
Figure 2.
Molecular-genetic characterization of the mnm locus. (A) Map of the mnm region, in polytene region 60B8–11: proximal (“P”) is left; distal (“D”) is right; center is a genomic scale, marked in kilobases. Orientations of transcription units are indicated by arrows: CG10339, CG13564 and CG16786 (deduced from genomic sequence), mnm (CG3231), and genghis khan (gek). The position of the insertion of P(PZ)l(2)rQ313 is indicated. Exon/intron structure of the mnm cDNA (clone LD21643) is shown. The structure of the 1488-bp deletion in mnmPX1 is indicated. Below this are the structures of four transgenes, as described in the text. (B) A comparison between the deduced Drosophila Mini-me protein domain structure and the closest homologs in other species: M. musculus (mP2P-R), H. sapiens (hRBBP6), C. elegans, A. thaliana, S. pombe, and S. cerevisiae (Mpe1). Conserved domains: NT, N-terminal domain; Zn, Zinc knuckle; RING, RING finger, Pro, proline rich; and CC, coiled coil. (C) Amino acid sequence alignments of three of the conserved domains, as indicated. Species are as in B. Residue numbers are indicated, and the percentages of identity/similarity to Mnm are given. Solid residues are identical, residues with dark shading are conservative changes, and residues with light shading are unconserved changes.

