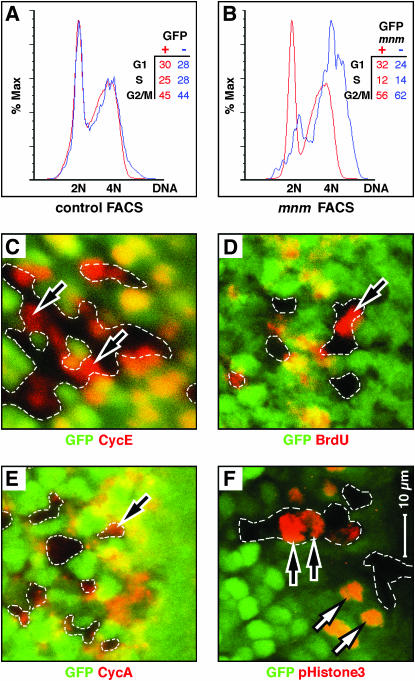
Figure 7.
mnm loss-of-function affects cell cycle progression. (A and B) Fluorescence-activated cell sorting (FACS) traces. Red curves are GFP+-expressing cells and blue are GFP− cells. DNA content (x-axes) is plotted against the percentage of maximal absorbance (y-axes). Insets show the percentages of cells in each genotype distributed between the phases G1, S, and G2/M. Cells were prepared from third larval wing imaginal discs containing hs:FLP-induced, GFP-marked mosaic clones, 24 hr after clone induction. (A) Control discs in which both the GFP+ and GFP− cell populations are mnm+. Note that the red and blue curves are superimposed with major peaks interpreted as 2N and 4N DNA content. (B) Cells prepared from imaginal discs in which the GFP+ cells are either mnm+ homozygotes or mnm+/mnmPX1. As mnm is recessive, all the GFP+ cells are phenotypically wild type. The GFP− cells are mnmPX1 homozygotes. Note the rightward shift of the GFP− mnm mutant cells, suggesting elevated DNA content, and an increased percentage of cells are scored as G2/M. (C–F) Third instar eye-imaginal discs, with fields shown posterior to the morphogenetic furrow, containing GFP-marked mnmPX1 homozygous clones. Anterior is to the right and C–F are to the same scale (bar in F). GFP is green and the antigens are in red: (C) Cyclin E (G1 phase), (D) BrdU (S phase), (E) Cyclin A (G2 phase), and (F) phosphorylated Histone H3 (pH3, M phase). Note that mnmPX1 mutant cells can express all four of these markers (black arrows), indicating that no cell cycle phase is absent.

