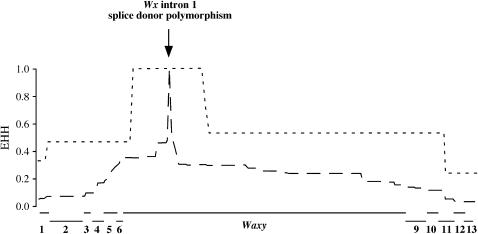
Figure 2.
EHH across the Wx genomic region. Short-dashed and long-dashed lines indicate EHH values for individuals with and without the Wx intron 1 splice donor mutation, respectively. The relative position of the Wx splice donor mutation is indicated. Numbers along x-axis indicate flanking genes (see labels in Figure 1); horizontal lines indicate which polymorphisms correspond to a particular gene.

