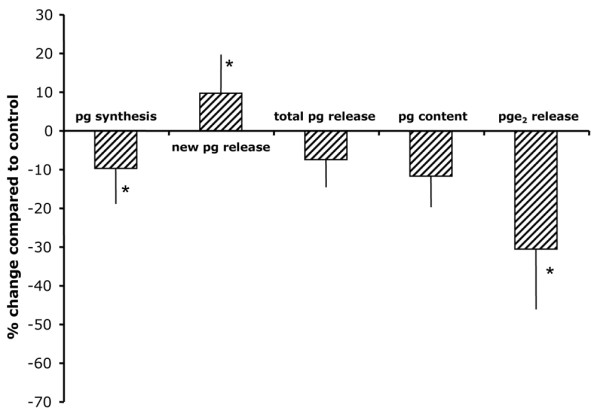
Figure 4.

Effect of a selective COX-1 inhibition on OA cartilage. Shown are the percentage changes compared with healthy cartilage of proteoglycan synthesis rate as a measure of cartilage matrix synthesis (pg synthesis); percentage release of newly formed proteoglycans (new pg release) as a measure of retention of the newly formed proteoglycans (normalized to the synthesis of these proteoglycans); percentages total release of proteoglycans (total pg release), measured as the percentage release of glycosaminoglycans (normalized to glycosaminoglycan content); proteoglycan content (pg content) and prostaglandin E2 release (pge2 release) under the influence of 0.1 μmol/l SC-560 (a selective COX-1 inhibitor). The results are presented as means of five experiments (with each cartilage sample from the different donors) ± standard error. The absolute values of untreated controls are as follows: prostaglandin synthesis rate 3.4 ± 1.3 nmol/hour per g; % new prostaglandin release 11.4 ± 0.6%; total prostaglandin release 6.4 ± 1.1%; and prostaglandin content 17.9 ± 0.8 mg/g. Significant differences between SC-560 treated and untreated cartilage were calculated using nonparametric paired analysis (*P < 0.05).
