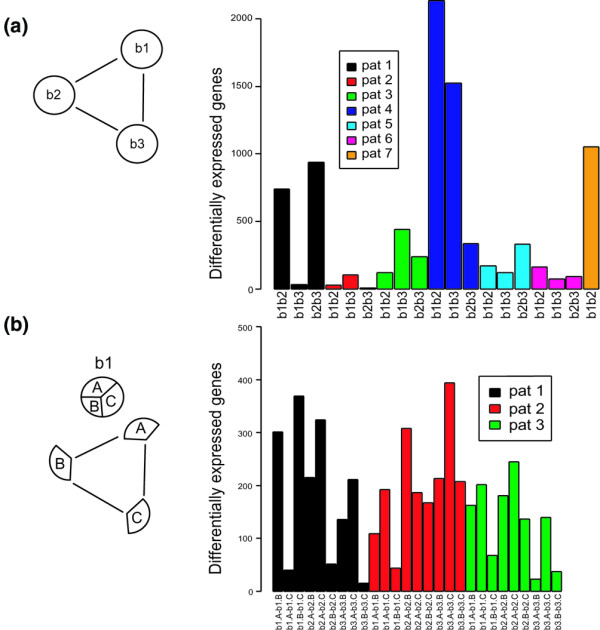
Figure 2.

Differentially expressed genes between orthopedic biopsies and sub-biopsies. (a) As shown in the scheme at the left, comparisons were made patient by patient between all biopsies from all seven patients. Because of the degradation of RNA in the third biopsy, only two biopsies from patient 7 could be compared. The results from the between-biopsy comparisons can be seen in the barplot at the right. The first comparison to the left in the barplot b1b2 represents the comparison between biopsies 1 and 2 of patient 1. In total, 4,175 unique genes were found to vary between the different biopsies. (b) Comparisons were performed patient by patient and biopsy by biopsy between each sub-biopsy for patients 1, 2, and 3 in accordance with the scheme at the left. The results from all comparisons are displayed in the barplot at the right. The first comparison at the left in the barplot (b1.A-b1.B) illustrates the comparison between sub-biopsies A and B of biopsy 1 of patient 1. In total, 2,493 unique genes were found to vary between the sub-biopsies.
