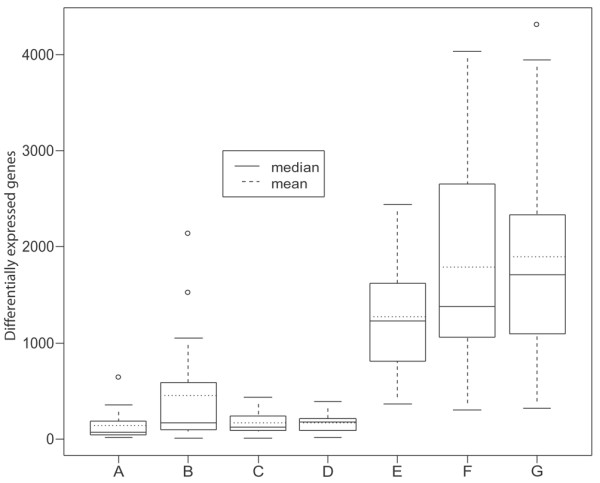
Figure 6.

Boxplots of the differentially expressed (DE) genes in the different comparisons. Boxplot A shows the number of DE genes between the arthroscopic biopsies shown in Figure 5a. Boxplot B shows the number of DE genes between the orthopedic biopsies shown in Figure 2a. Boxplot C shows the number of DE genes between orthopedic biopsies excluding the comparisons involving biopsies 1 and 3 of patient 1, biopsy 1 of patient 4, and biopsy 1 of patient 7. Boxplot D shows the number of DE genes between the sub-biopsies as shown in Figure 2b. Boxplot E shows the number of DE genes between the arthroscopic patients. Boxplot F shows the number of DE genes between the orthopedic patients. Boxplot G shows the number of DE genes between the orthopedic patients excluding biopsies 1 and 3 of patient 1, biopsy 1 of patient 4, and biopsy 1 of patient 7 from the comparisons.
