
Figure 1.
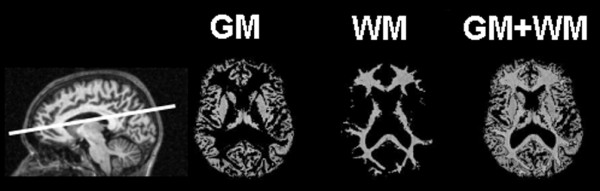
Example of segmented axial MTR map (level indicated at the sagittal image). Visualized are the compartments grey matter (GM), white matter (WM) and grey and white matter (GM + WM). Signal intensities represent MTR values. MTR, magnetization transfer ratio.