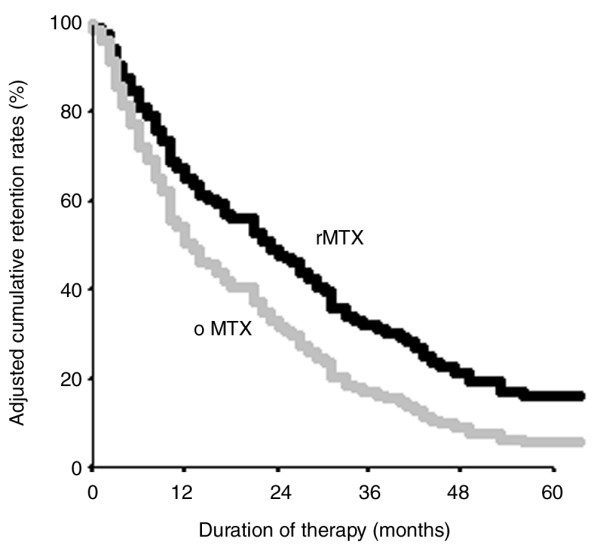
Figure 3.

Adjusted cumulative retention rates of MTX therapies. Based on a Cox proportional hazards regression model, cumulative retention rates for original therapies (grey lines; oMTX) and re-employed therapies (black lines; rMTX) are shown adjusted for the use in 1999 or later and methotrexate dose (lines for oMTX and rMTX are plotted at the cohort mean of these covariates). Re-employed courses showed a significant lower Hazard Ratio of treatment discontinuation compared to the original courses (P = 0.04). All courses that were ongoing, lost to follow up, or terminated because of incompliance were censored in this analysis.
