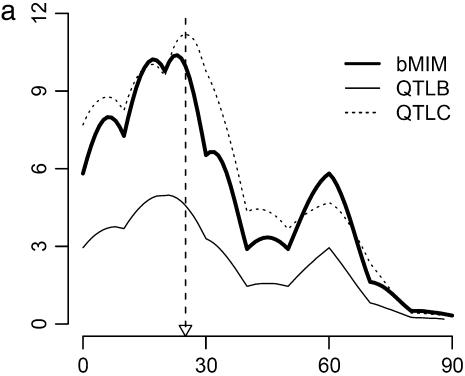
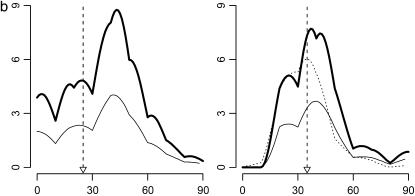
Figure 1.—
Likelihood-ratio (LR) profiles for three approaches with various parameter values. Each plot represents the result on a specific chromosome, with the x-axis for chromosome locations and the y-axis for LR. In each plot, the thick solid line is for the result of bMIM, the thin solid line for that of QTLB, and the dotted line for that of QTLC, if the QTL is detected by the respective approaches. Small triangles along the x-axis (and the corresponding dashed lines) indicate positions of simulated QTL. (a) One chromosome, one QTL; (b) two chromosomes, two QTL; (c) four chromosomes, four QTL; and (d) eight chromosomes, eight QTL (chromosomes 6 and 7 are not shown since no QTL is detected on them).


