
TABLE 3.
Estimation results for data with different category proportions
| Proportion of individuals having 0 trait value
|
|||||||
|---|---|---|---|---|---|---|---|
| No. of data sets detecting a certain no. of QTLa | 0.2
|
0.35
|
0.5
|
||||
| QTLB | bMIM | QTLB | bMIM | QTLB | bMIM | QTLC | |
| 0 | 25 | 2 | 7 | 0 | 10 | 0 | 0 |
| 1 | 44 | 14 | 39 | 4 | 36 | 4 | 12 |
| 2 | 25 | 31 | 39 | 20 | 35 | 20 | 22 |
| 3 | 4 | 35 | 14 | 41 | 14 | 42 | 35 |
| 4 | 1 | 14 | 1 | 31 | 5 | 32 | 29 |
| 5 | 1 | 4 | 0 | 4 | 0 | 2 | 2 |
| Mean | 1.15 | 2.57 | 1.63 | 3.11 | 1.87 | 3.08 | 2.87 |
| Estimated heritability | |||||||
| h2 | 0.102 | 0.175 | 0.121 | 0.202 | 0.132 | 0.198 | 0.205 |
| SDb | 0.052 | 0.067 | 0.053 | 0.063 | 0.059 | 0.062 | 0.073 |
Results in this and all following tables are based on 100 simulated data sets, unless indicated otherwise. 4C4Q with h2 = 0.3 is simulated for this table.
a
Values are the numbers of data sets (of 100) detecting certain numbers of QTL (given in the leftmost column). Mean is computed as 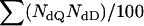 , where NdQ is the number of detected QTL and NdD is the number of data sets detecting NdQ QTL.
b
Values are the standard deviation for the corresponding heritability estimation.