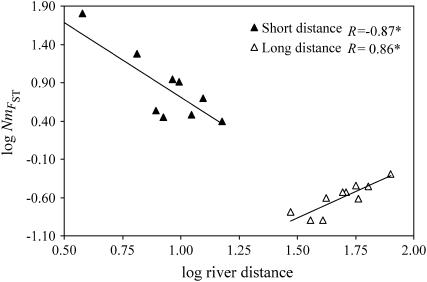
Figure 3.—
Plot of log  against log river distance. Pairwise comparisons between two groups of sample sites comprise the five most downstream locations (yielding short-distance comparisons) and the five most upstream locations in separate rivers (yielding long-distance comparisons). R is the correlation coefficient; *Mantel tests, P < 0.05.

