Figure 1.—
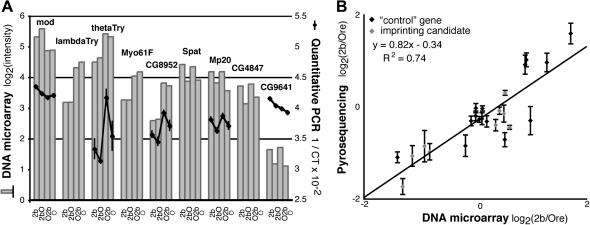
DNA microarrays, quantitative PCR, and pyrosequencing produce similar measures of gene expression. (A) Expression of nine imprinting candidate genes selected from the Gibson et al. (2004) microarray study is shown in the bar chart. Quantitative PCR (qPCR) measurements of gene expression are shown by the black line graphs for five of the nine genes. For each genotype, two replicate cDNA synthesis reactions [using poly(T) primers] were performed with RNA extracted from three independent pools containing 12–14 flies each. Gene-specific Taqman probes (Heid et al. 1996) (Applied Biosystems) were used to measure expression in all six cDNA pools for each genotype, in duplicate. The inverse of the critical threshold (1/CT) was fitted to the following linear model using proc MIXED in SAS v. 8.02 (Cary, NC) for each gene, as described in (Fiumera et al. 2005): Yijk = μ + Genotypei + Poolij + cDNAijk + PLD + ε, where Y = 1/CT for the gene of interest, i is the genotype index (Ore, O2b, 2bO, 2b), j is the pool index (1, 2, 3), k is the cDNA sample index (1, 2), and PLD = 1/CT for the pld gene. Genotype was treated as a fixed effect, Pool and cDNA as random effects, and PLD as a covariate. Analyses using srebp expression as a covariate instead of pld expression gave similar results; expression of srebp and pld was strongly correlated (R2 = 0.97). LS means for each genotype are plotted with error bars indicating the standard error. (B) Relative expression between 2b and Ore (2b/Ore), measured by pyrosequencing, is plotted against the ratio of 2b/Ore expression reported in the Gibson et al. (2004) microarray data set. For pyrosequencing, total RNA and genomic DNA were sequentially extracted from four mixed pools, each containing seven Ore and seven 2b flies. RNA from each pool was used in three independent cDNA synthesis reactions with a poly(T) primer. After normalization using measurements from genomic DNA (Landry et al. 2005), the log2(2b/Ore) ratio from pyrosequencing (Y) was fitted to a gene-specific model including a random effect of replicate pools: Yi = μ + Pooli + ε, where i is the the pool index (1, 2, 3, 4). Estimates and standard errors of the intercept (μ) are shown. Supplemental Table 1 (http://www.genetics.org/supplemental/) summarizes expression levels measured using DNA microarrays, qPCR, and pyrosequencing.

