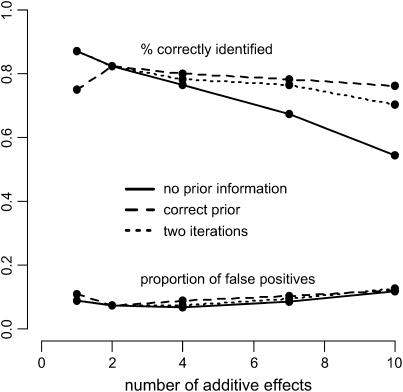
Figure 3.—
Percentage of correctly identified additive effects vs. number of additive effects. The QTL are unlinked, i.e., located on different chromosomes, and have effect sizes of 0.5. The solid line is based on simulations where no prior information is used to derive the penalty terms of the modified BIC. The dashed line represents simulations with the correct number of underlying effects (1, 2, 4, 7, and 10) assumed known. The dotted line corresponds to the two-step search procedure based on formula (4).

