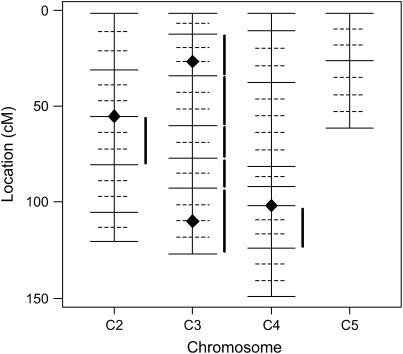
Figure 6.—
Genetic map for the D. virilis experiment by Huttunen et al. (2004). Solid horizontal lines indicate observed marker positions, and dotted lines show imputed positions. QTL localized by our proposed method are symbolized by diamonds. Intervals with significant additive and/or dominance effects found by Huttunen et al. (2004) applying composite interval mapping are indicated by solid vertical lines.

