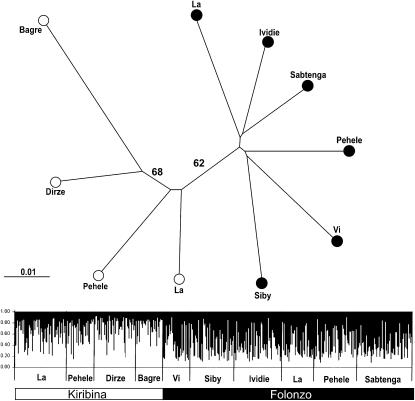
Figure 2.—
Clustering of A. funestus study populations from Burkina Faso, inferred from microsatellites. Top: Neighbor-joining tree based on Nei et al.'s (1983) DA distance. Bootstrap values >50% are shown. Branches are labeled by sampling location (village) and chromosomal form assignment (solid circles, Folonzo; open circles, Kiribina). Bottom: Plot from an unsupervised STRUCTURE run of highest estimated probability at k = 2 (two clusters). Each individual is represented by a vertical line in which shading (solid or open) indicates membership coefficients (scale bar at left) for alternative clusters corresponding to Folonzo and Kiribina. Plot is partitioned into 10 segments representing samples of Kiribina or Folonzo from different villages. Village names are indicated below the plot, and chromosomal form membership (determined independently by karyotyping) is indicated at the bottom by a bar.

