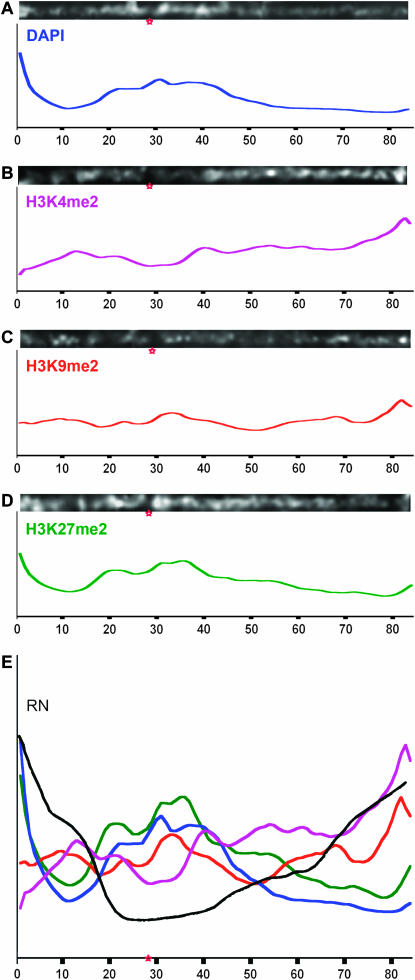
Figure 2.—
Staining patterns on chromosome 9. (A–D) Lowess-smoothed curves showing the general trends for several staining patterns. (A) DAPI staining, showing the distribution of heterochromatin. (B) H3K4me2 staining, showing a distribution that is skewed up toward chromosome ends and negatively correlated with heterochromatin. (C) H3K9me2 staining, showing a flat distribution that trends upward similar to H3K4me2. (D) H3K27me2 staining, showing a distribution that closely follows heterochromatin. (E) A combination plot of A–D and the recombination nodules map for chromosome 9 in black (adapted from Anderson et al. 2003). Red stars show the positions of centromeres.

