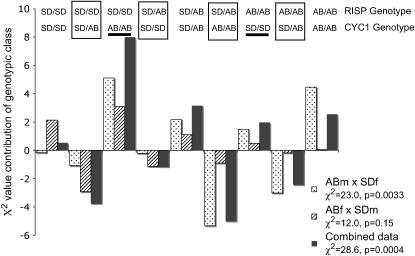
Figure 3.—
Relative contributions to χ2-deviations for genotype-by-genotype classes in F2 hybrids of a cross between SD and AB for T. californicus for CYC1 and RISP. The magnitude, direction, and cross type are all as indicated in Figure 1. Boxed classes are heterozygous/homozygous comparisons while the two underlined classes are nonparental homozygous/homozygous comparisons. The χ2-value for each cross and associated P-value are given below each cross name in the inset. Note the difference in scale of the y-axis from Figure 2.

