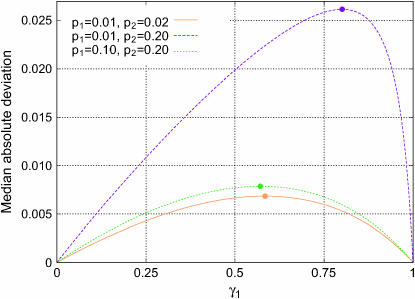
Figure 5.—
Median absolute deviation from the null hypothesis (Δdisc, Equation 10) in a discrete subpopulation model with two subpopulations. The median deviation over 10,000 simulations is plotted against γ1, the fraction contributed by subpopulation 1. Three combinations of the phenotype frequencies p1 and p2 in the two populations are considered, and the population divergence parameter F is set to 0.01. The maximal deviation predicted by Equation 31 occurs at the values marked with circles. For (p1, p2) = (0.01, 0.02),  for (0.01, 0.20),
  for (0.10, 0.20), γmax =
  .
.

