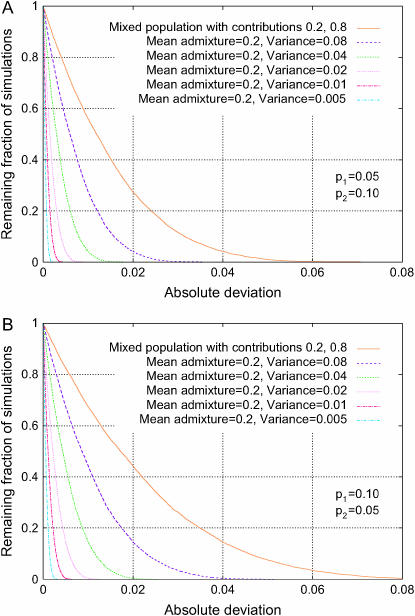
Figure 7.—
Distribution of the absolute deviation from the null hypothesis in an admixture model (Δadm, Equation 23). The fractions of 10,000 simulations that exceed given levels of absolute deviation are plotted for various choices of the variance across individuals of the admixture fraction for population 1 in a two-subpopulation model with admixture contributions 0.2 and 0.8 for the two subpopulations; the curves with mean admixture 0.2 and variance 0.01 use similar values to estimates for European ancestry in African–Americans (Patterson et al. 2004, mean of 0.21, standard deviation of 0.11). For comparison, Δdisc for a mixture of discrete subpopulations is also shown. Both the top and the bottom plots use a level of population divergence of F = 0.10, and they differ only in the phenotype frequencies of the two underlying subpopulations. (A) p1 = 0.05, p2 = 0.10; (B) p1 = 0.10, p2 = 0.05.

