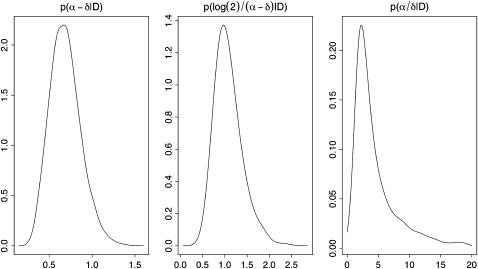
Figure 1.—
Marginal posterior densities of net transmission rate α − δ, doubling time log(2)/(α − δ), and reproductive value α/δ. The data used are from Small et al. (1994). The prior distribution of the mutation rate is p(θ) ∼ N(0.198, 0.067352) and the tolerance level ɛ = 0.0025.

