
Figure 1.
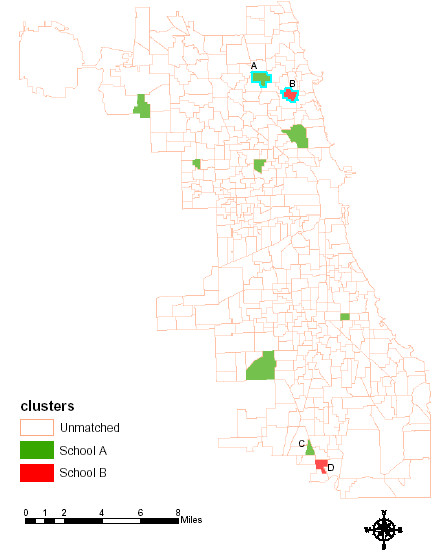
Chicago elementary school neighborhood cluster matching with BMI data. Showed in green are the matched schools to school A with a lower obesity rate Showed in red are the matched schools to school B with a higher obesity rate Showed in white (blank) are the unmatched schools to bother school A and B