
Figure 4.
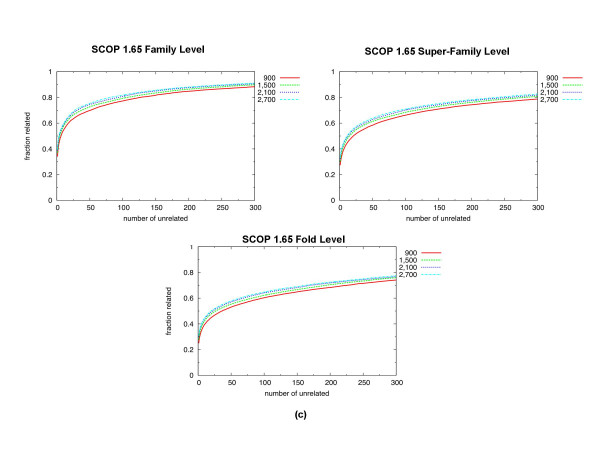
Saturation of performance with the number of models. Coverage versus Error plots for our method with different number of models: 900, 1, 500, 2,100 and 2, 700 models. (a) Pairs in the same SCOP family are true positives; pairs in different SCOP families are false positives. (b) Pairs in the same SCOP super-family are true positives; pairs in different SCOP super-families are false positives. (c) Pairs in the same SCOP fold are true positives; pairs in different SCOP folds are false positives.