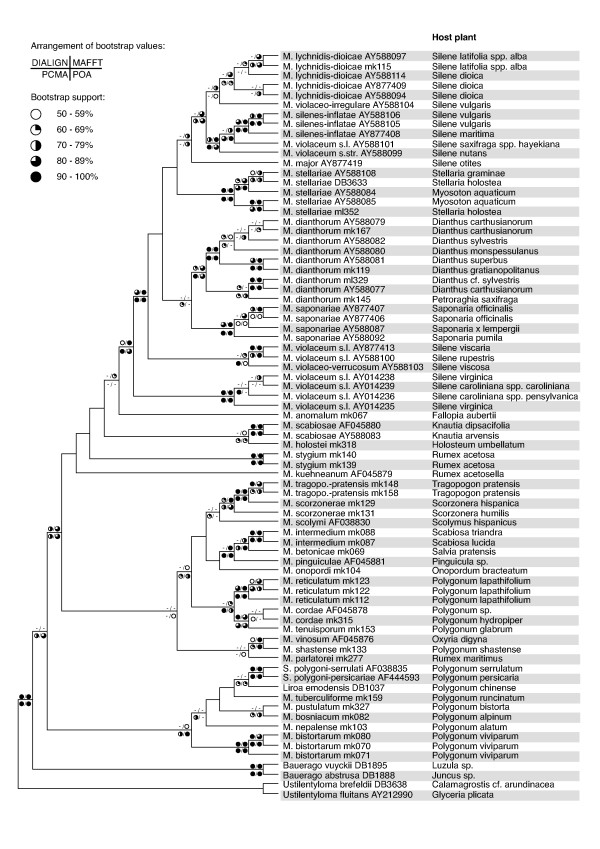
Figure 3.
Maximum likelihood majority-rule consensus inferred from the datasets of the three different alignments. The right side of the picture indicates the host plant for each parasite. Symbols on branches indicate the magnitude of likelihood bootstrap values from analyses of the dataset after exclusion of alignment-ambiguous sites (upper left) and of the three different, complete alignments made with MAFFT (upper right), PCMA (lower left), and POA (lower right). Abbreviations are as in Fig. 1.

