Figure 4.

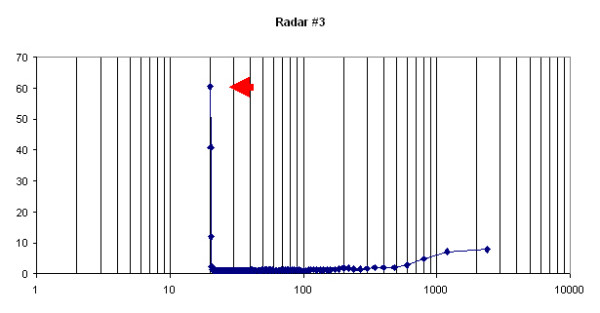
Spectral analysis of data from Test 1. The peak at 20 bins corresponds to 60 seconds (1 bin = 3 sec). Power values on the y-axis; x-axis is periods (in seconds) in logarithmic scale.

Spectral analysis of data from Test 1. The peak at 20 bins corresponds to 60 seconds (1 bin = 3 sec). Power values on the y-axis; x-axis is periods (in seconds) in logarithmic scale.