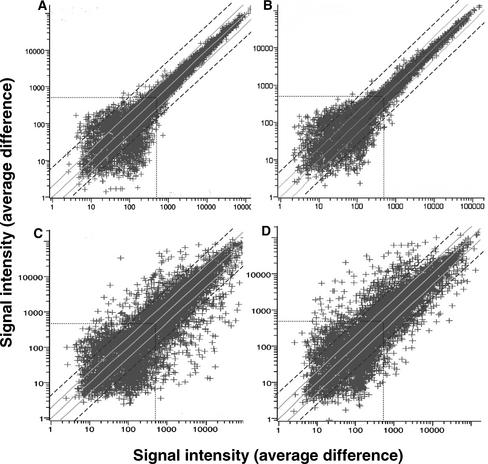
Figure 1.
Scatterplots Comparing Gene Expression Levels of ∼8200 Arabidopsis Genes at Different Times during Shoot Development.
Gene expression levels (represented by signal intensities or average differences) were analyzed by Affymetrix Arabidopsis oligonucleotide arrays. Solid gray lines represent twofold differences in signal intensity (gene expression) from the diagonal (same signal intensity in both hybridizations), and dashed black lines represent fourfold differences in signal intensity. Dotted lines represent the arbitrary signal intensity threshold of 500.
(A) Control scatterplot used to assess chip-to-chip error variation by comparing time 0 (chip 1, x axis) with time 0 (chip 2, y axis). In this control experiment, the same probe was hybridized to two different chips.
(B) Additional control scatterplot to assess experiment-to-experiment error variation by comparing 3 days on SIM (experiment 1, x axis) with 3 days on SIM (experiment 2, y axis). In this control experiment, two different probes derived from different experiments conducted several months apart were hybridized to two different chips.
(C) and (D) Scatterplots comparing time 0 (chip 1, x axis) with 2 days on CIM (y axis) (C) and time 0 (chip 1, x axis) with 15 days on SIM (y axis) (D).

