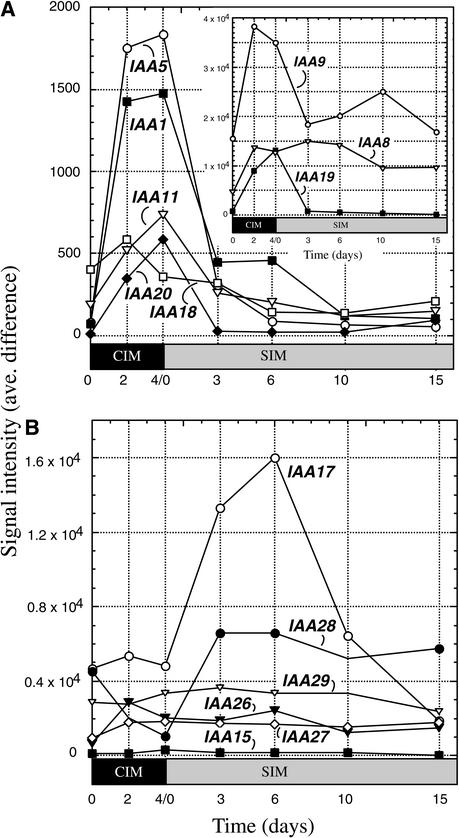
Figure 6.
Expression Profiles of Genes That Encode Aux/IAA Proteins during Shoot Development.
(A) Expression profiles for Aux/IAA genes upregulated during preincubation on auxin-rich CIM. The inset shows profiles for three genes with higher expression profiles (note the difference in scale).
(B) Expression profiles for Aux/IAA genes not upregulated specifically during preincubation on CIM. Expression levels at different time points during shoot development are expressed as signal intensity (average difference).

