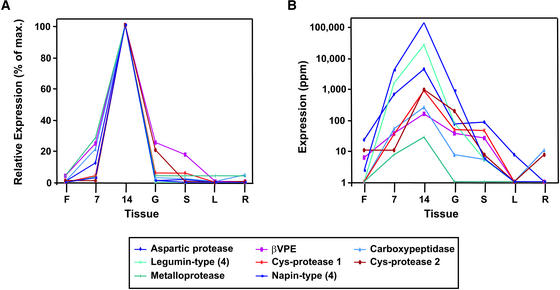
Figure 8.
Expression Profiles of the Seed Storage Protein and Protease Genes Identified in the Seed Protein–Specific Expression Cluster (GEC98).
(A) The expression profile of each gene or of a storage protein gene group (average of four genes; see key) is plotted as a percentage of expression relative to maximum observed expression across all tissues sampled. Tissues sampled were inflorescences (F), seeds at 7 DAA (7), seeds at 14 DAA (14), germinating seeds (G), seedlings (S), leaves (L), and roots (R).
(B) Expression profiles plotted as a log scale of transcript levels in parts per million. Tissues and genes are the same as in (A).

